Knowing the Future
The desire to predict earthquakes is a natural one, particularly if you happen to live in an area prone to them. In most parts of the world even a mild earthquake can lead to devastation. Occasionally there is the major or great quake which can cause death and destruction across continent sized areas and even in the most prepared cities. It is human instinct to crave certainty, because through certainty we have a feeling of being in control. The fear of not knowing when such a catastrophe may strike, not being in control, pushes many to seek ways to predict them.
Whether earthquakes can be predicted at all is still a debate unsolved. The reality is that we simply do not yet know enough detail about how earthquakes occur to know whether they can truly be predicted or not, although great strides are being made everyday towards finding out. Earthquakes are still much of a mystery even to those who have spent their lives studying them. The fact that science is still struggling to explain what seems to many to be the most basic characteristics of earthquakes leaves some to feel that science isn't all it's cracked up to be. Perhaps all the scientists and their science is wrong, or they're looking so hard in one direction that maybe they're missing the obvious in another.
Unfortunately, this desire to explain that which we fear - the unknown - combined with this notion that science is faulty leads some to accept some truly bizarre ideas regarding earthquake prediction. These pseudoscientific prediction methods find root with the public masses because of their lack of education. It's not so much that the average Joe is stupid, but more that scientific thinking is hard to do. It takes practice to become a critical thinker and to realize that the mainstream quake predictors are just full of it. Sadly, there's even a deceitful side to some of these predictors, taking advantage of people by pushing their books and newsletters - all for a fee of course - knowing full well that they are making a living off the gullibility of the masses. Then again, there are some who so believe their own pseudoscience that they don't even realize that they are deceiving others, much less themselves.
No matter what the method of prediction, whether it be astrology or syzygy's or snail trails on the back porch, there seems to be some common threads among those predictors who claim high successes. A quick review of the major players in the world of quake prediction shows they all have certain traits which allows them to have some success. These successes are then used to reinforce their belief - and that of their followers - that their method has some merit.
The common characteristics of most "successful" predictors can be summarized easily - their prediction areas are so large, the time frames are so long, and that they fudge their hits with "close enough" that they are almost guaranteed to get it right. It's almost like predicting below zero temps with blowing snow in Antarctica.
Making Predictions
As an exercise I decided to publish my own daily predictions to see how well I could do in comparison to the other guys using nothing more than some basic knowledge of where earthquakes are known to occur. I had no need of analyzing tea leaves or any other dubious method. In fact, my method is so deterministic that I was able to write simple computer code to automate much of the process. However, I did leave some room to allow predictions based "on a whim".
My predictions, unlike many predictors, are well defined. Although I did not until this article explain how I make my predictions, I did clearly state the parameters of the predictions - location, area, and time frame. Many of the predictions that are made are vague enough to allow some wiggle room for the predictor to use "close enough" strategies to increase their hit ratio. I chose instead to eliminate any ambiguities which would leave room for doubt.
The basic rules of my predictions can be summarized as follows:
- Each prediction is a circle 1000km in diameter from a specified lat/lon coordinate.
- Each prediction is good for exactly five days from a specified time to the second.
- There are eleven predictions per day.
- Predictions are for quakes magnitude 4 and up.
- Aftershocks count.
These parameters were chosen based on the average characteristics of one particular earthquake predictor, but serves well to show how having a large enough area, a long enough time frame, and enough predictions - all parameters common to many quake predictions - can lead to success. The only missing ingredient is choosing where to make the predictions.
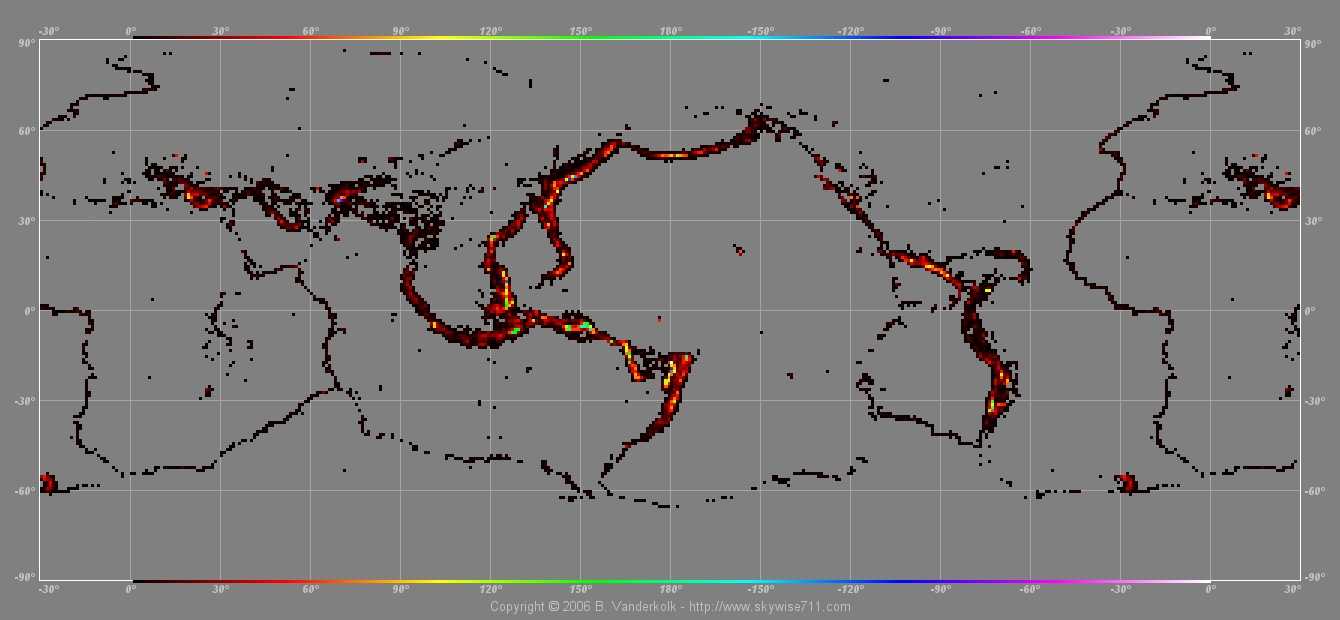 |
1 degree density map of all earthquakes equal to or larger than magnitude 4 from 1973 thru 2004. This is used as a guide for where to make predictions. |
To prepare for my daily predictions I used data from the United States Geological Survey (USGS) National Earthquake Information Center (NEIC) database to make a map of earthquake density in one degree squares (see above). This density map of historical earthquakes is the missing ingredient which allows me to place my prediction circles in places where there are likely to be a lot of future earthquakes.
Since each map is good for five days and I have eleven predictions per day, that means I have 55 predictions in a given five day period to play with. The first thing I did was to pre-place these circles on the map so as to cover all the major zones of quake activity such as the infamous Ring-of-Fire. The idea is that over the five days of predictions the major quake zones would be fully covered in a rotating schedule of predictions (see maps below).
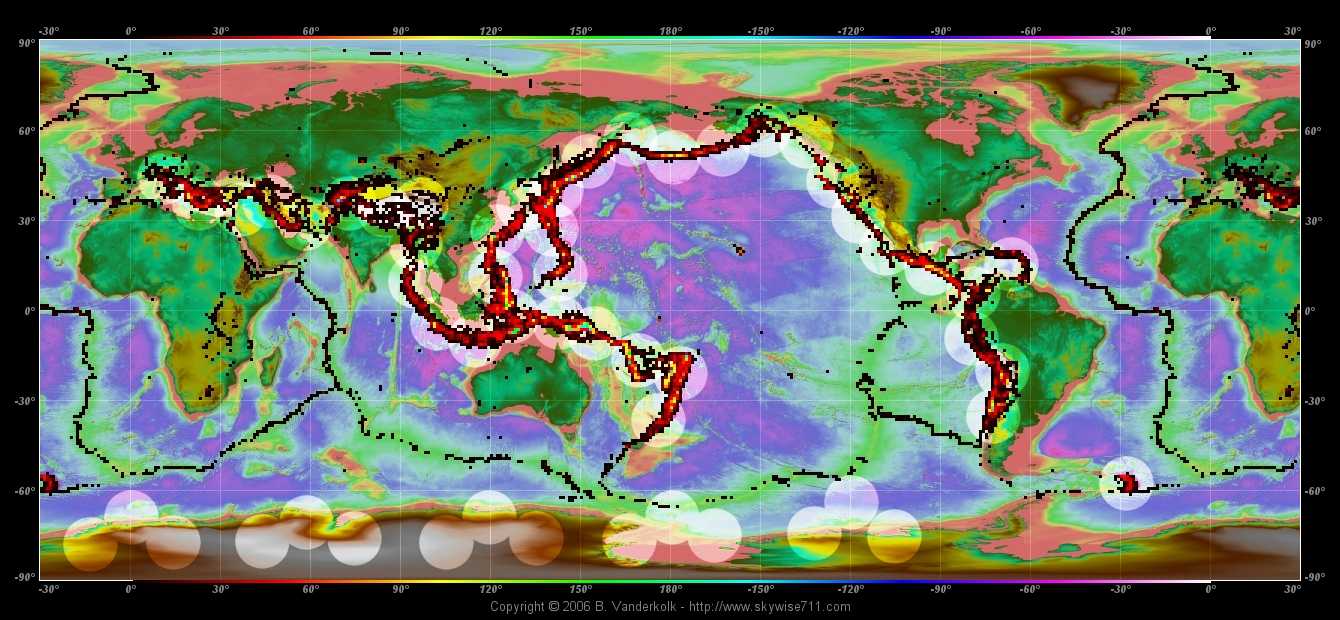 |
Topography with density map and all five days worth of pre-placed prediction circles. The five sets of 3 circles arranged in Antarctica are those reserved for manual placement. |
 |
 |
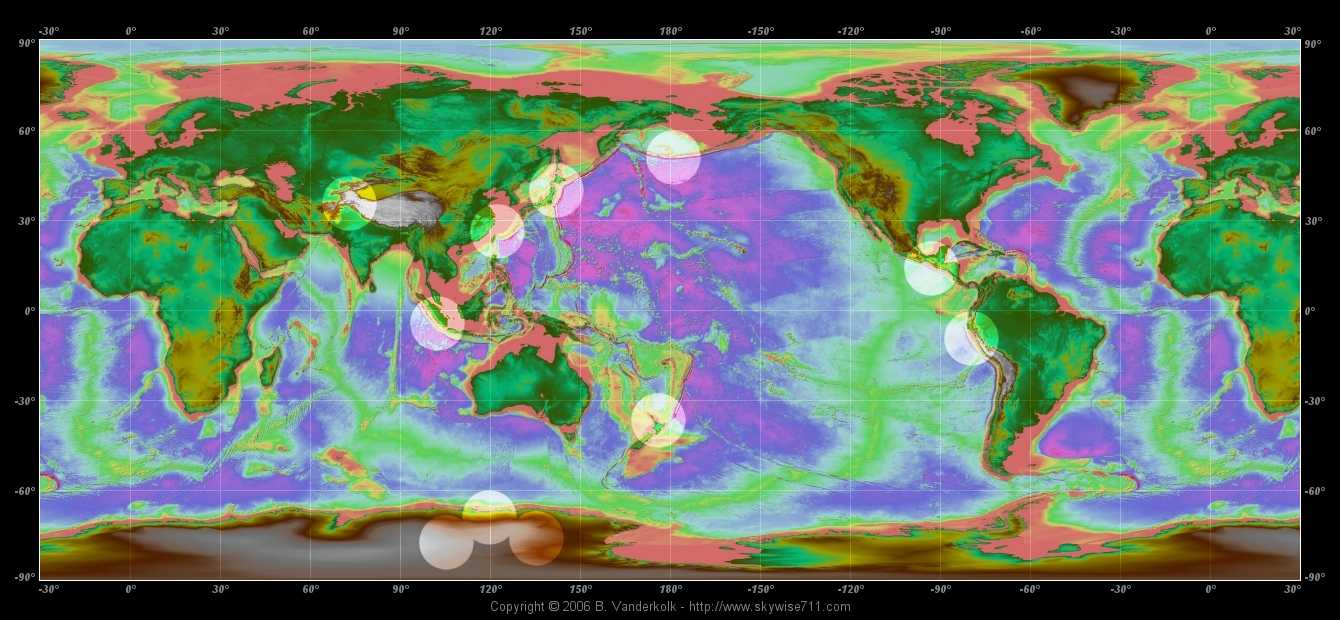 |
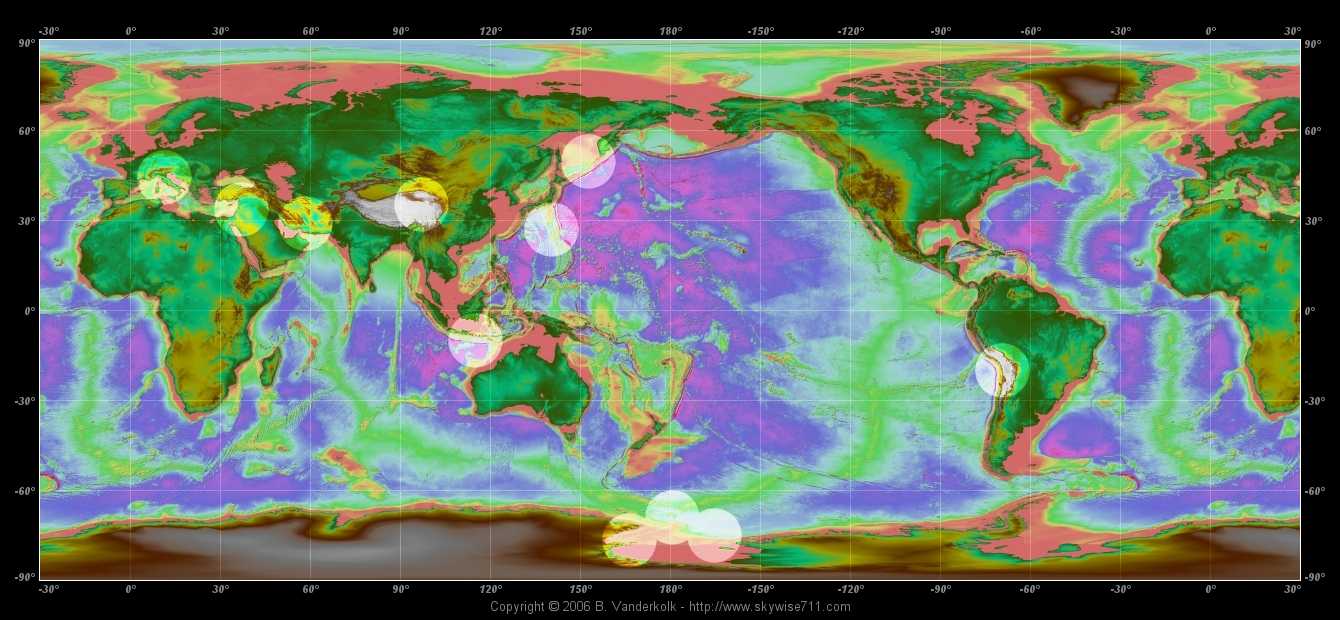 |
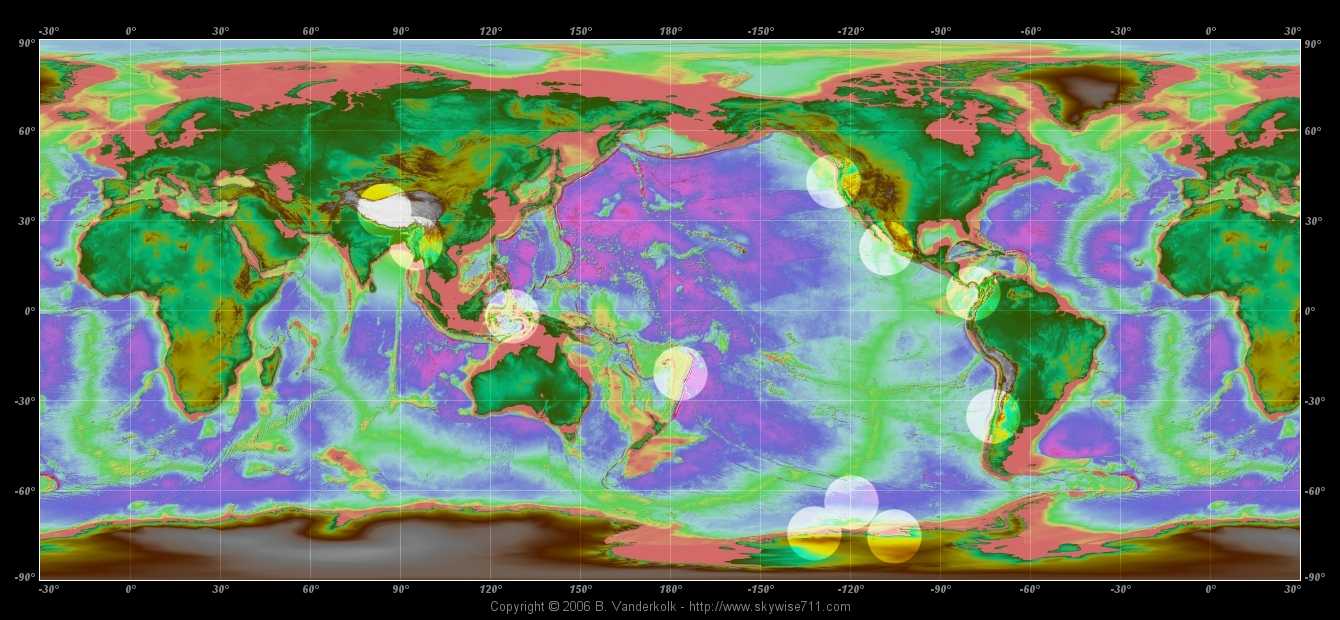 |
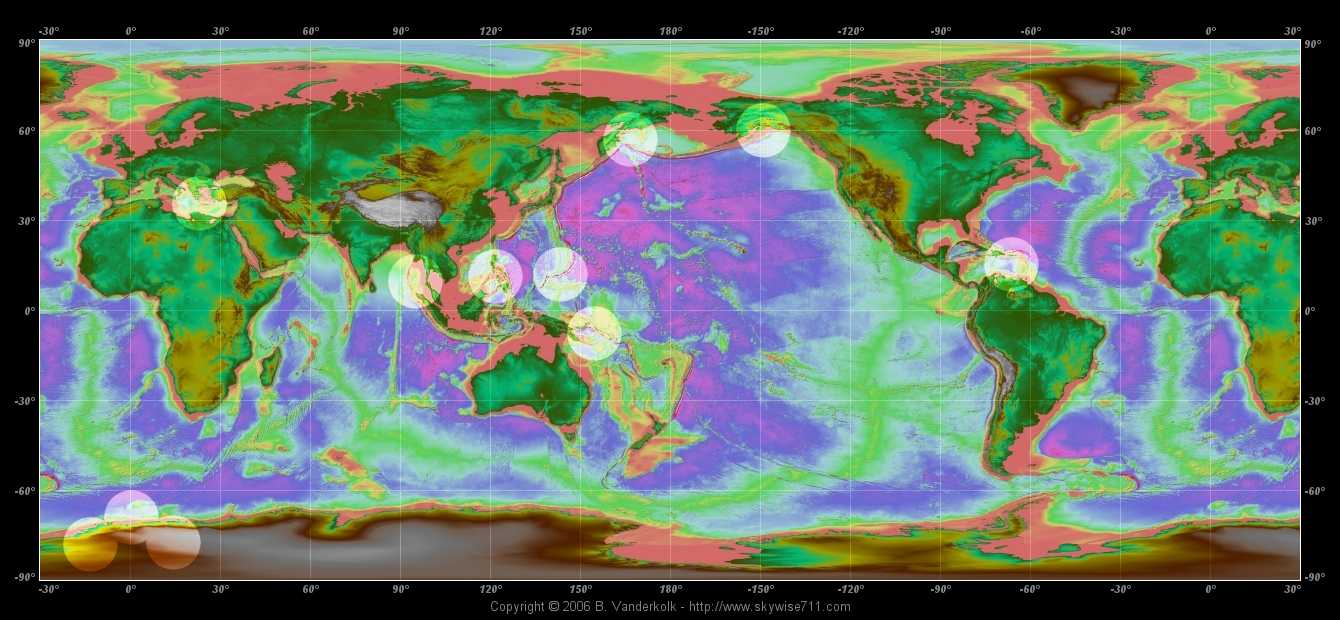
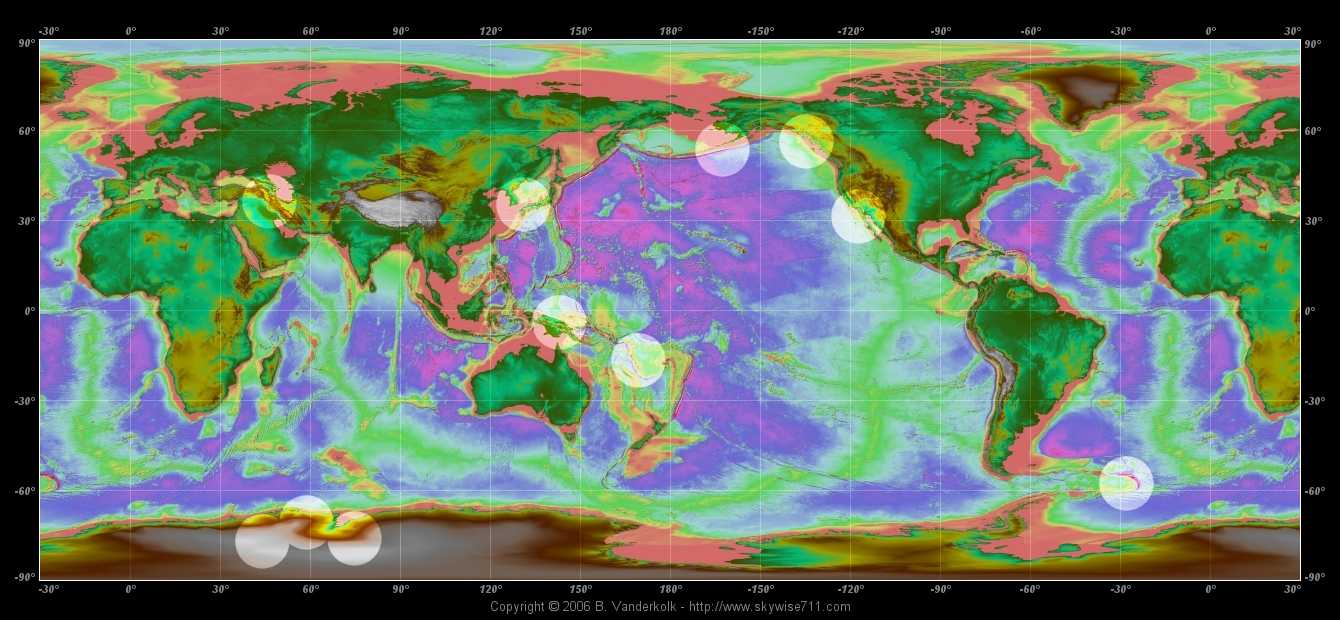
These images show the five different daily maps with their pre-placed circles. Their positions are varied randomly by software +- 1 degree. The three circles in Antarctica are those placed manually for catching aftershocks or just "on a whim". |
Due to the size of my prediction circles I found it unnecessary to use all eleven of each days predictions to cover the major seismic zones. I decided to reserve three predictions per day for manual placement. I used these circles to make predictions "on a whim" or to cover areas outside the normal automatic predictions where earthquakes were less frequent but still likely to occur. This also allowed me to catch aftershocks of those few quakes that I missed predicting entirely.
Since I still had to place three circles per day manually, choosing their location was sometimes difficult. Usually I would base their locations on previous activity occurring outside of the pre-placed set of circles. Typically these were along mid ocean ridges or hotspots such as the Hawaiian Islands. Other times I would just "feel" like putting a prediction in a particular place. Interestingly, I still managed to hit a few significant quakes this way, most notably the M6.8 quake in the Lake Tanganyika region in Africa that occurred on December 5, 2005, or the M6.1 quake along the Pacific-Antarctic ridge soon after on December 22.
Success?
Analysis of the quake predictions to check for hits was done automatically through software. Most quake predictors only manually check against the daily lists that are posted on the many websites of earthquake related research organizations. Unfortunately, these daily lists are neither accurate nor complete. I chose to wait a period of at least two weeks before confirming any possible hits and then the checking was done against the USGS NEIC global catalog. This time period is to allow the quake data to stabilize (eg magnitudes change as more data is gathered) and because the catalog lists far more quakes than get put on the daily lists.
Every few days I would download the entire NEIC catalog from just before I started my prediction exercise and do a confirmation run. The software not only produces a summary of the results, but also a detailed listing of every quake that was a "hit" and the prediction or predictions that produced that hit. Due to the overlapping nature of some of the prediction circles, some quakes were predicted more than once, in a few rare occasions as many as four or five times. In all cases these are counted as only a single hit.
List Generated: 2006/ 2/ 6 21:24: 5. 3 |
| A summary listing from the confirmation software and the first few lines of detailed listings. This confirmation run is the one the details of this article are based on. |
Early on the results were low, but as time passed the score steadily increased. The results presented here represent 90 days worth of predictions.
"Close Enough"
Although the rules of my predictions and the criteria for determining a hit were clearly laid out in advance, it is interesting to see what the results are when I start adding in some fudge factors to allow for "close enough" or for smaller quakes. In one particular predictors results I have studied, there have been quakes claimed as hits that fell far outside of their plotted circles. In one case, the M7.6 Pakistan quake on October 8, 2005, the claimed hit was so far outside the closest circle that it would have required a doubling of the size of the circle for the epicenter to even touch it!
Allowing for "close enough" the results of my prediction exercise for the same time span results in an increase in both the hit ratio for number of quakes predicted and the ratio for number of predictions with a hit.
List Generated: 2006/ 2/ 7 4:45:54.101 |
| Summary listing of same predictions if a "close enough" factor is allowed, effectively doubling the size of the prediction circles. |
Some predictors will also claim quakes with magnitudes outside of their originally stated prediction. Others will claim any quake as a hit, even if it is of a very low magnitude. The results of my predictions improve even further when also including all quakes down to magnitude 2.5.
List Generated: 2006/ 2/ 7 4:46:27. 69 |
| The summary listing if we now allow quakes as small as M2.5 and "close enough" fudge factor. |
But Does It Mean Anything?
As for the accuracy of my predictions, I stated at the beginning that over a course of 90 days, there were a total of 2510 earthquakes of magnitude 4.0 or larger around the globe (that were within the time windows of my predictions), and that of those 2510 earthquakes, I successfully "predicted" 2276 of them giving a hit ratio of 90.7%. At first that sounds like a really good statistic. But let's look at this another way, the right way. Over that same 90 day period, I made a total of 990 predictions. Out of those 990 predictions, only 650 actually had any earthquakes fit them. So in reality, my success rate is only 65.6%. This is the true measure of my predictions.
So what does this mean for the typical quake predictor, even if they have a good success rate? Probably they have unknowingly stacked the deck in their favor by the size of their prediction areas, times, and any "close enough" fudge factor. We know where earthquakes tend to occur, at least over the long term average. Nearly anyone with even a passing interest in earthquakes is familiar with the Ring-of-Fire. Even if a predictor were not consciously doing so, they are likely placing their predictions in places where earthquakes are a regular occurrence.
If you make enough predictions, eventually you'll get a hit. And this is where the lack of scientific and critical thinking takes root and grows. Predictors tend to only report their hits and work hard to ignore their failures. Even when the failures are forced to be addressed, they're rationalized away. I could easily make a case for myself based on how many quakes I predicted compared to how many occurred, but that is dismissing how many predictions I've made that were failures, which is a much worse number.
The sad part of all this is when you try to confront a quake predictor with these simple statistical facts. They will hold stead fast to their belief in their methods. Because they already feel science is failing them, why should they believe anyone who says they are wrong based on some scientific facts? These predictors - and more importantly their followers - need to understand that there is a certain level of probability that they are going to have to beat before their successful predictions will truly mean anything.
Where Next?
Often times when someone approaches science with their ideas about predicting quakes, they are met with ridicule or silence. This is then used by the psuedoscientists to further their claim that scientists have it wrong or are hiding something. Of course, we realize the fallacy in their logic, claiming that since we won't prove them wrong they must be right. Unfortunately our silence works against us. Not everyone has an understanding of critical thinking and the scientific method and they can be easily swayed by the boisterous ramblings of someone railing against the system.
It is not an easy task confronting these wild claims on the fringe and bringing knowledge to the people. It's all to easy to simply ignore the noise. We should all, as scientists, do more to support education and outreach projects. More emphasis needs to be made not only on the facts as we know them, but as well as the ways of logic and thinking used to uncover those facts. Also, one does not need a PhD to be a scientist and a critical thinker. Amateur scientists should be supported in their efforts as they are closer to the people. Often times they are in a better position and are more willing to clash head on with those who simply do not understand what "science" is.
Educating the public is key to furthering science as a whole. It is becoming more and more difficult for scientists in many fields to gather support and funding for their work because the majority of the public just doesn't understand the science. Helping the public to understand how science works and why we do it will also let them understand how this same science helps them in their everyday lives. If we don't continue to teach science and reinforce basic scientific principles, science will fall by the wayside to fallacious logic and emotional decision making which can only hurt everyone.
By the way, I predict sub-freezing temperatures and blowing snow for tomorrow at the South Pole.
Appendix
Section 1 - Probability Analysis of EQDB Predictions - by Roger Hunter (coming soon)
Section 2 - Comparison of EQDB to Stan Deyo's 'Forecasts'
Section 3 - List of predictions
Section 4 - List of verified hits
Section 5 - NEIC catalog data used for verifying hits